 ArdenAlgo
Liquidity map
- A liquidity map is an inventory of prior-day/week extremes and equal-level clusters — the places stops actually rest.
- Clusters group swing extremes within 0.25 × ATR(14); a level stays on the map only while untapped.
- The engine requires untapped liquidity ahead of the trade direction before any setup is even considered.
What it is
Orders cluster where traders put stops: just beyond the prior day's and prior week's highs and lows, and behind equal highs / equal lows — those "double tops" that retail treats as walls. A liquidity map is simply an honest inventory of those levels, maintained per symbol, updated as sessions roll.
The exact engine rule
Why it matters
Most indicators react to price. Mapped liquidity is about anticipation: it tells the engine where a sweep would be meaningful. A sweep of a random level is noise; a sweep of a mapped, untapped pool is information — and only the second kind arms the state machine.
Common misuse
Treating every swing high as "liquidity" until the chart is wallpaper. The tolerance threshold and the untapped requirement exist precisely to keep the map sparse and testable. If everything is liquidity, nothing is.
Common questions
Is every swing high liquidity?
No. Without clustering tolerance and the untapped requirement, everything becomes 'liquidity' and nothing is testable. The map is deliberately sparse.
What makes a level 'untapped'?
No trade has printed through it since it formed. Once price trades through, the level is consumed and drops out of the map.
Why do targets come from the map?
Because a trade needs somewhere to go: the engine only takes setups whose direction points at untapped liquidity — the target exists before the entry does.
On real charts — marked vs. left alone
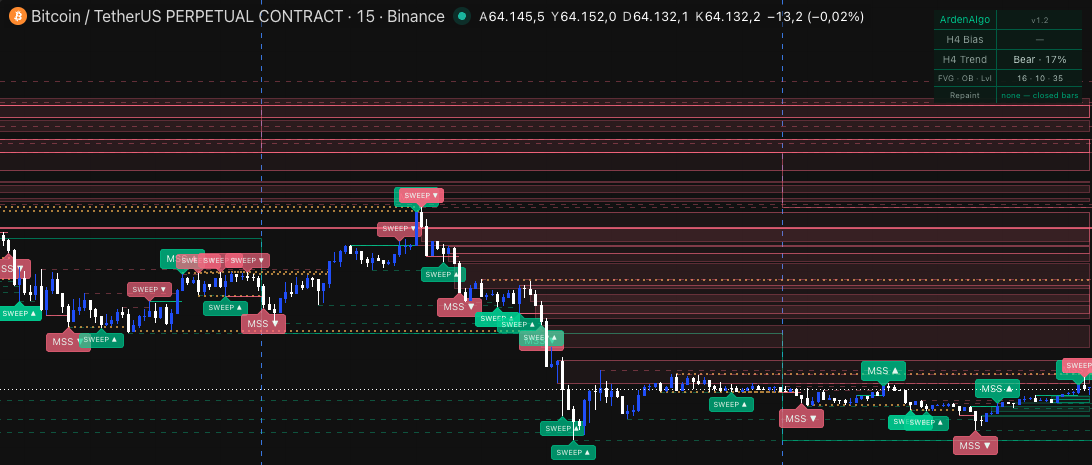
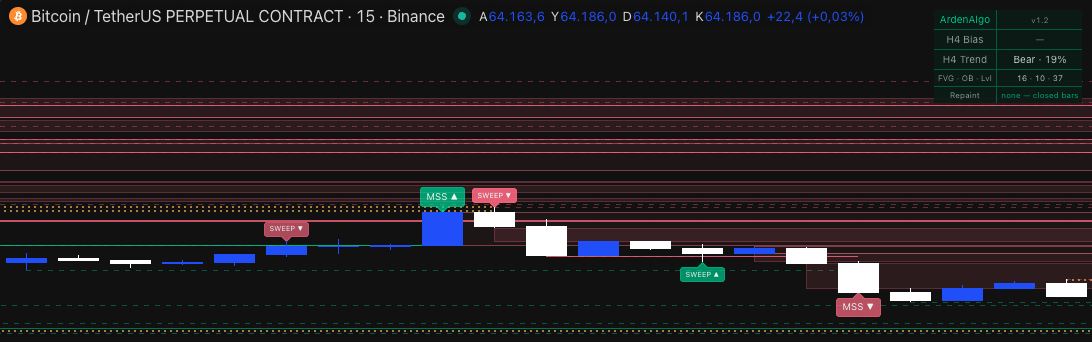
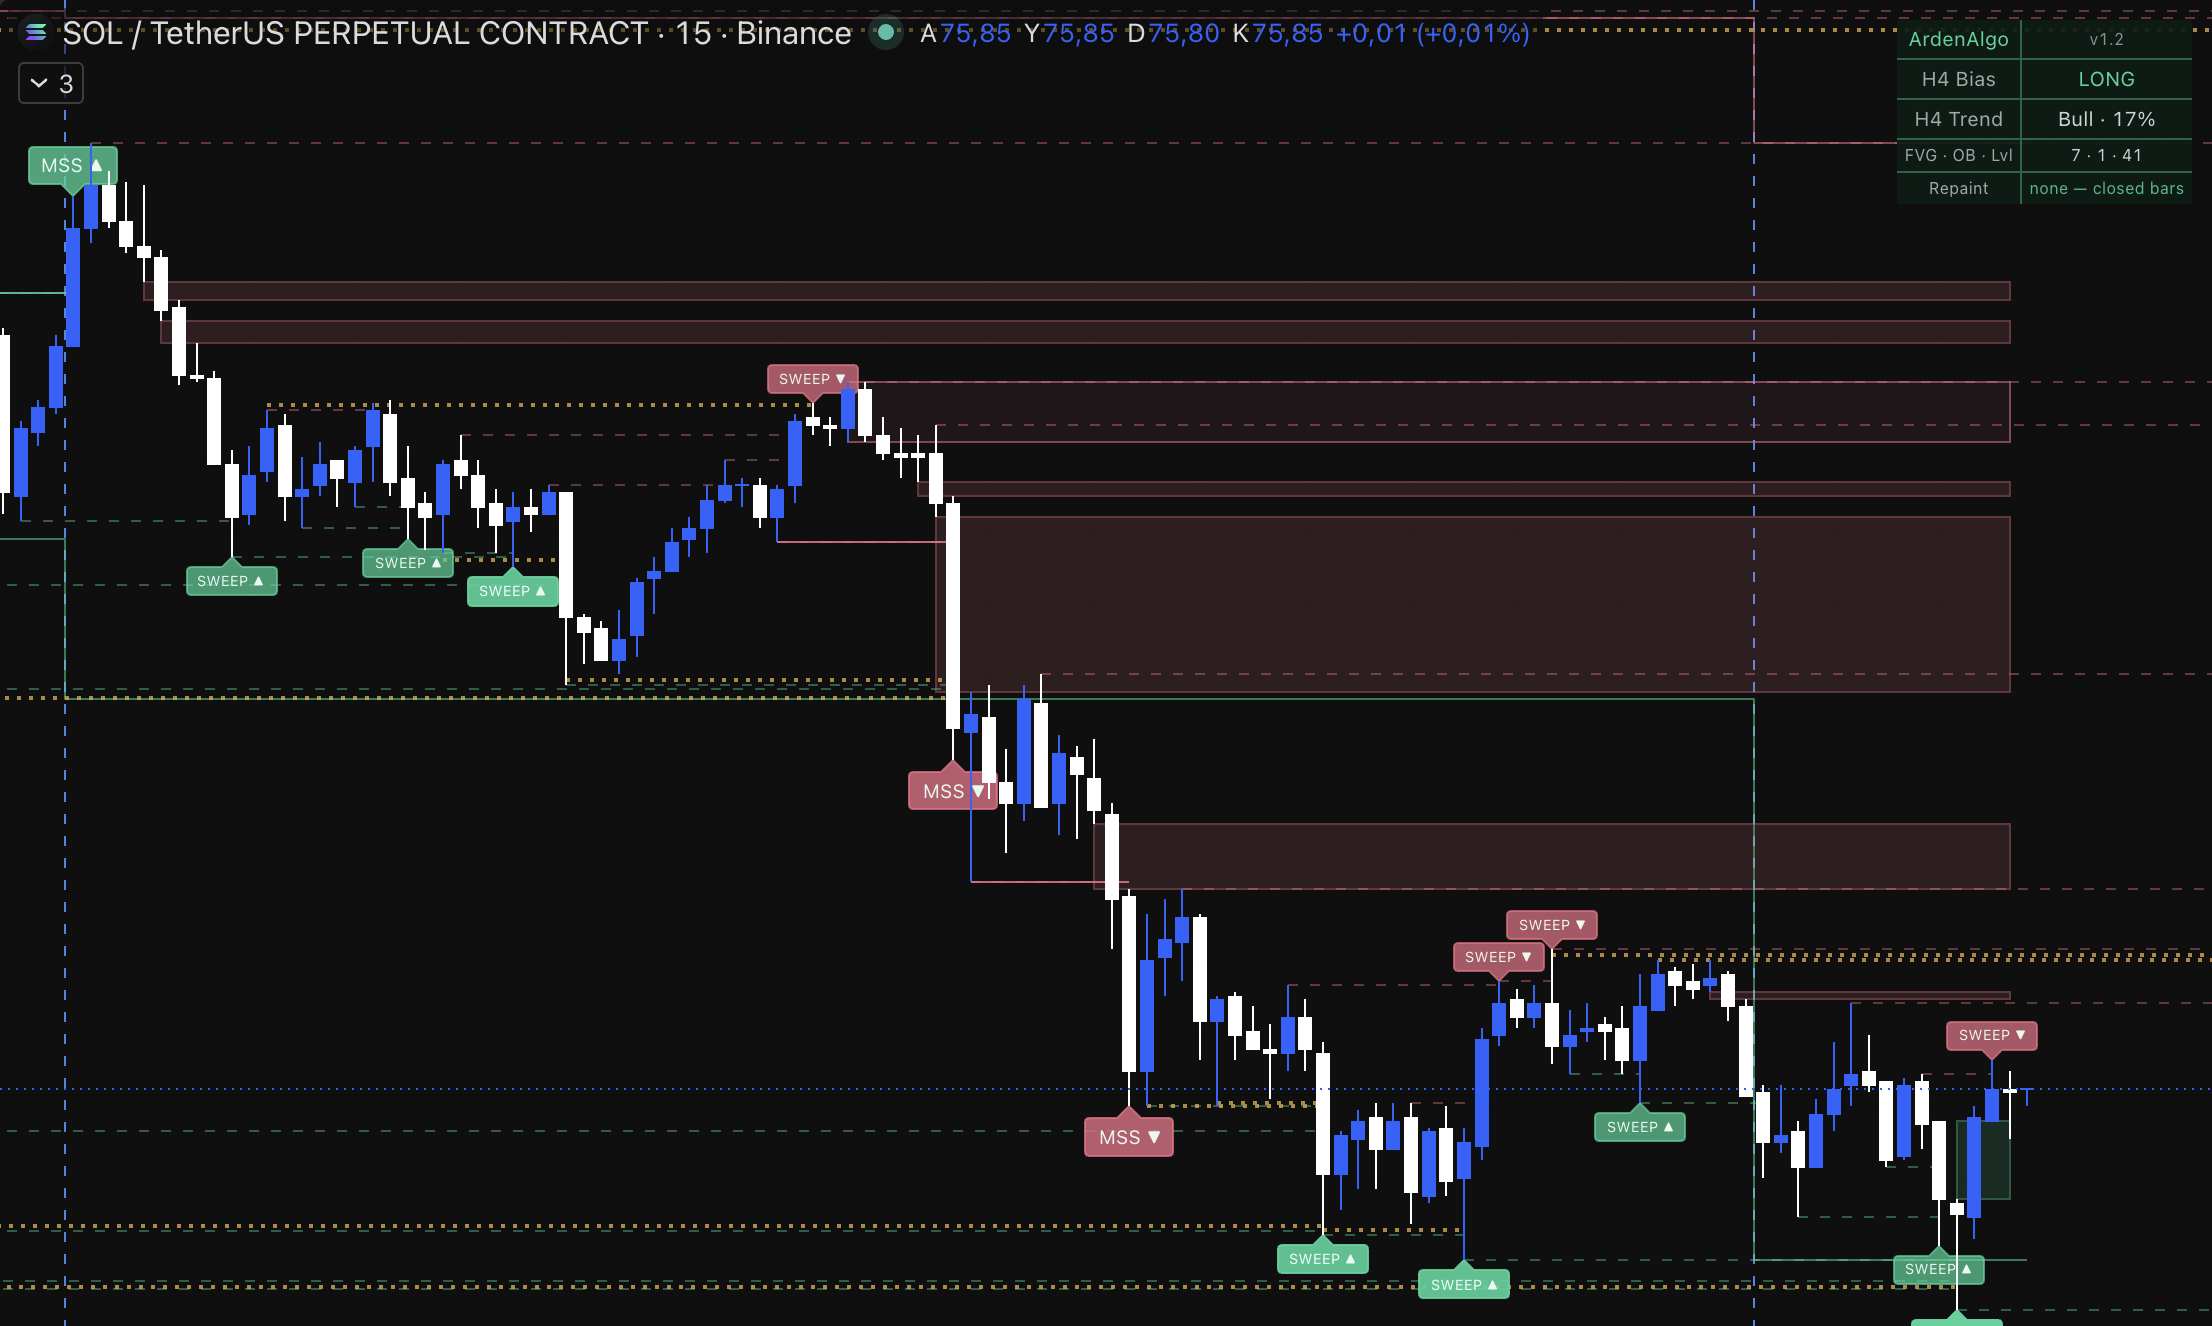
Below: the engine's own markings, captured from our TradingView indicator on live charts — screenshots, not illustrations. The second frame in each pair is the one nobody in this category publishes: a candidate that looks like the pattern and gets no mark, because it misses a threshold above. Rules are only testable if their failures are visible too.
Wider view of the same indicator on a live chart.