 ArdenAlgo
Fair value gap
- An FVG is a three-candle gap: wick one and wick three never overlap, on closed bars.
- Each FVG is tracked until ≈50% filled — beyond that it can no longer host an entry.
- The engine's entry is the last FVG of the confirming (MSS) leg, on the retest, within 32 bars.
What it is
When price moves with real displacement, it skips levels: the wick of candle one and the wick of candle three never overlap, leaving a three-candle gap where almost no business was done. The working hypothesis behind FVG trading is that price tends to revisit such inefficiencies — a tendency this engine tests against a random benchmark rather than assumes — which makes the FVG a natural candidate entry zone for the direction of the original move.
The exact engine rule
Entry on the retest, never the breakout
Chasing the displacement candle means paying the worst price of the move. Waiting for the retest of the gap flips the geometry: risk shrinks to the distance from the FVG to the sweep tip, and the target — the next untapped liquidity — stays where it was. That asymmetry is where the R:R in every alert comes from.
Common misuse
Trading every gap on every timeframe in isolation. An FVG with no bias, no armed zone and no confirmed MSS behind it is a pattern, not a plan. In this engine an FVG can only become an entry as the final step of the full sequence.
Common questions
Do all FVGs get filled?
No — and this engine doesn't assume it. Whether FVG-based entries beat random entry is exactly what the pre-registered evaluation tests.
Why enter on the retest instead of the breakout?
Chasing the displacement candle pays the worst price of the move. The retest shrinks risk (distance to the sweep tip) while the target stays put — that asymmetry is the R:R.
Can an FVG alone be a signal?
Not here. An FVG only becomes an entry as the final step of the full sequence: bias, zone, sweep, MSS, then the retest.
On real charts — marked vs. left alone
Below: the engine's own markings, captured from our TradingView indicator on live charts — screenshots, not illustrations. The second frame in each pair is the one nobody in this category publishes: a candidate that looks like the pattern and gets no mark, because it misses a threshold above. Rules are only testable if their failures are visible too.
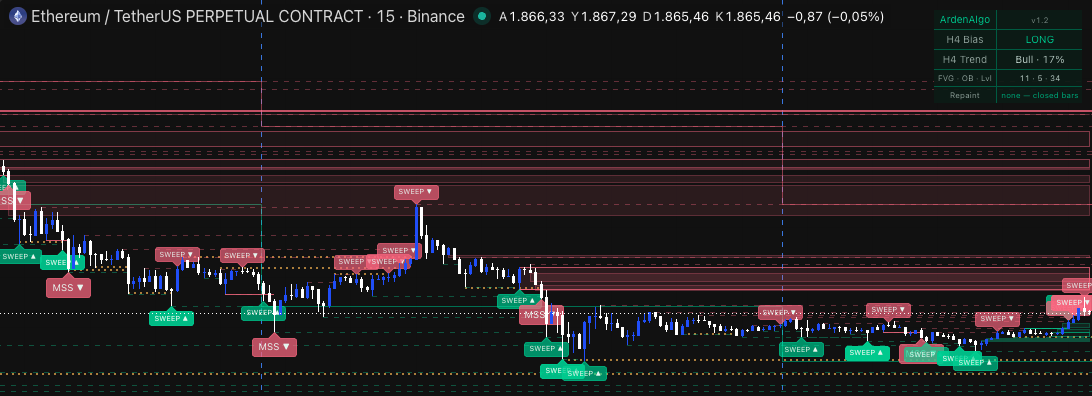
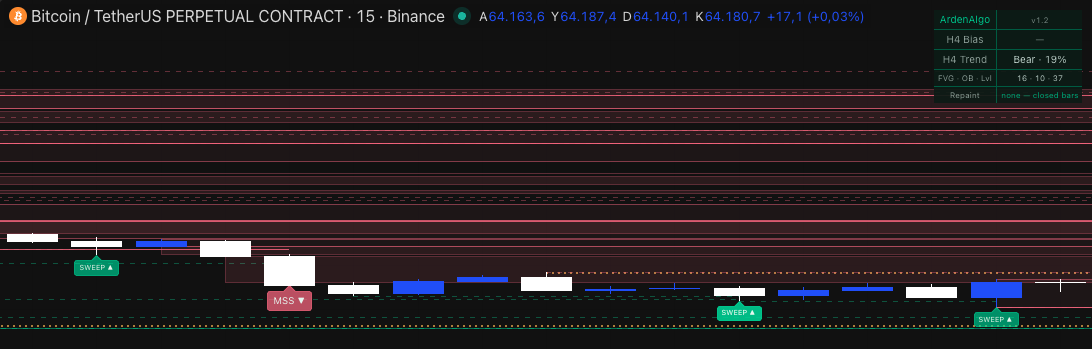
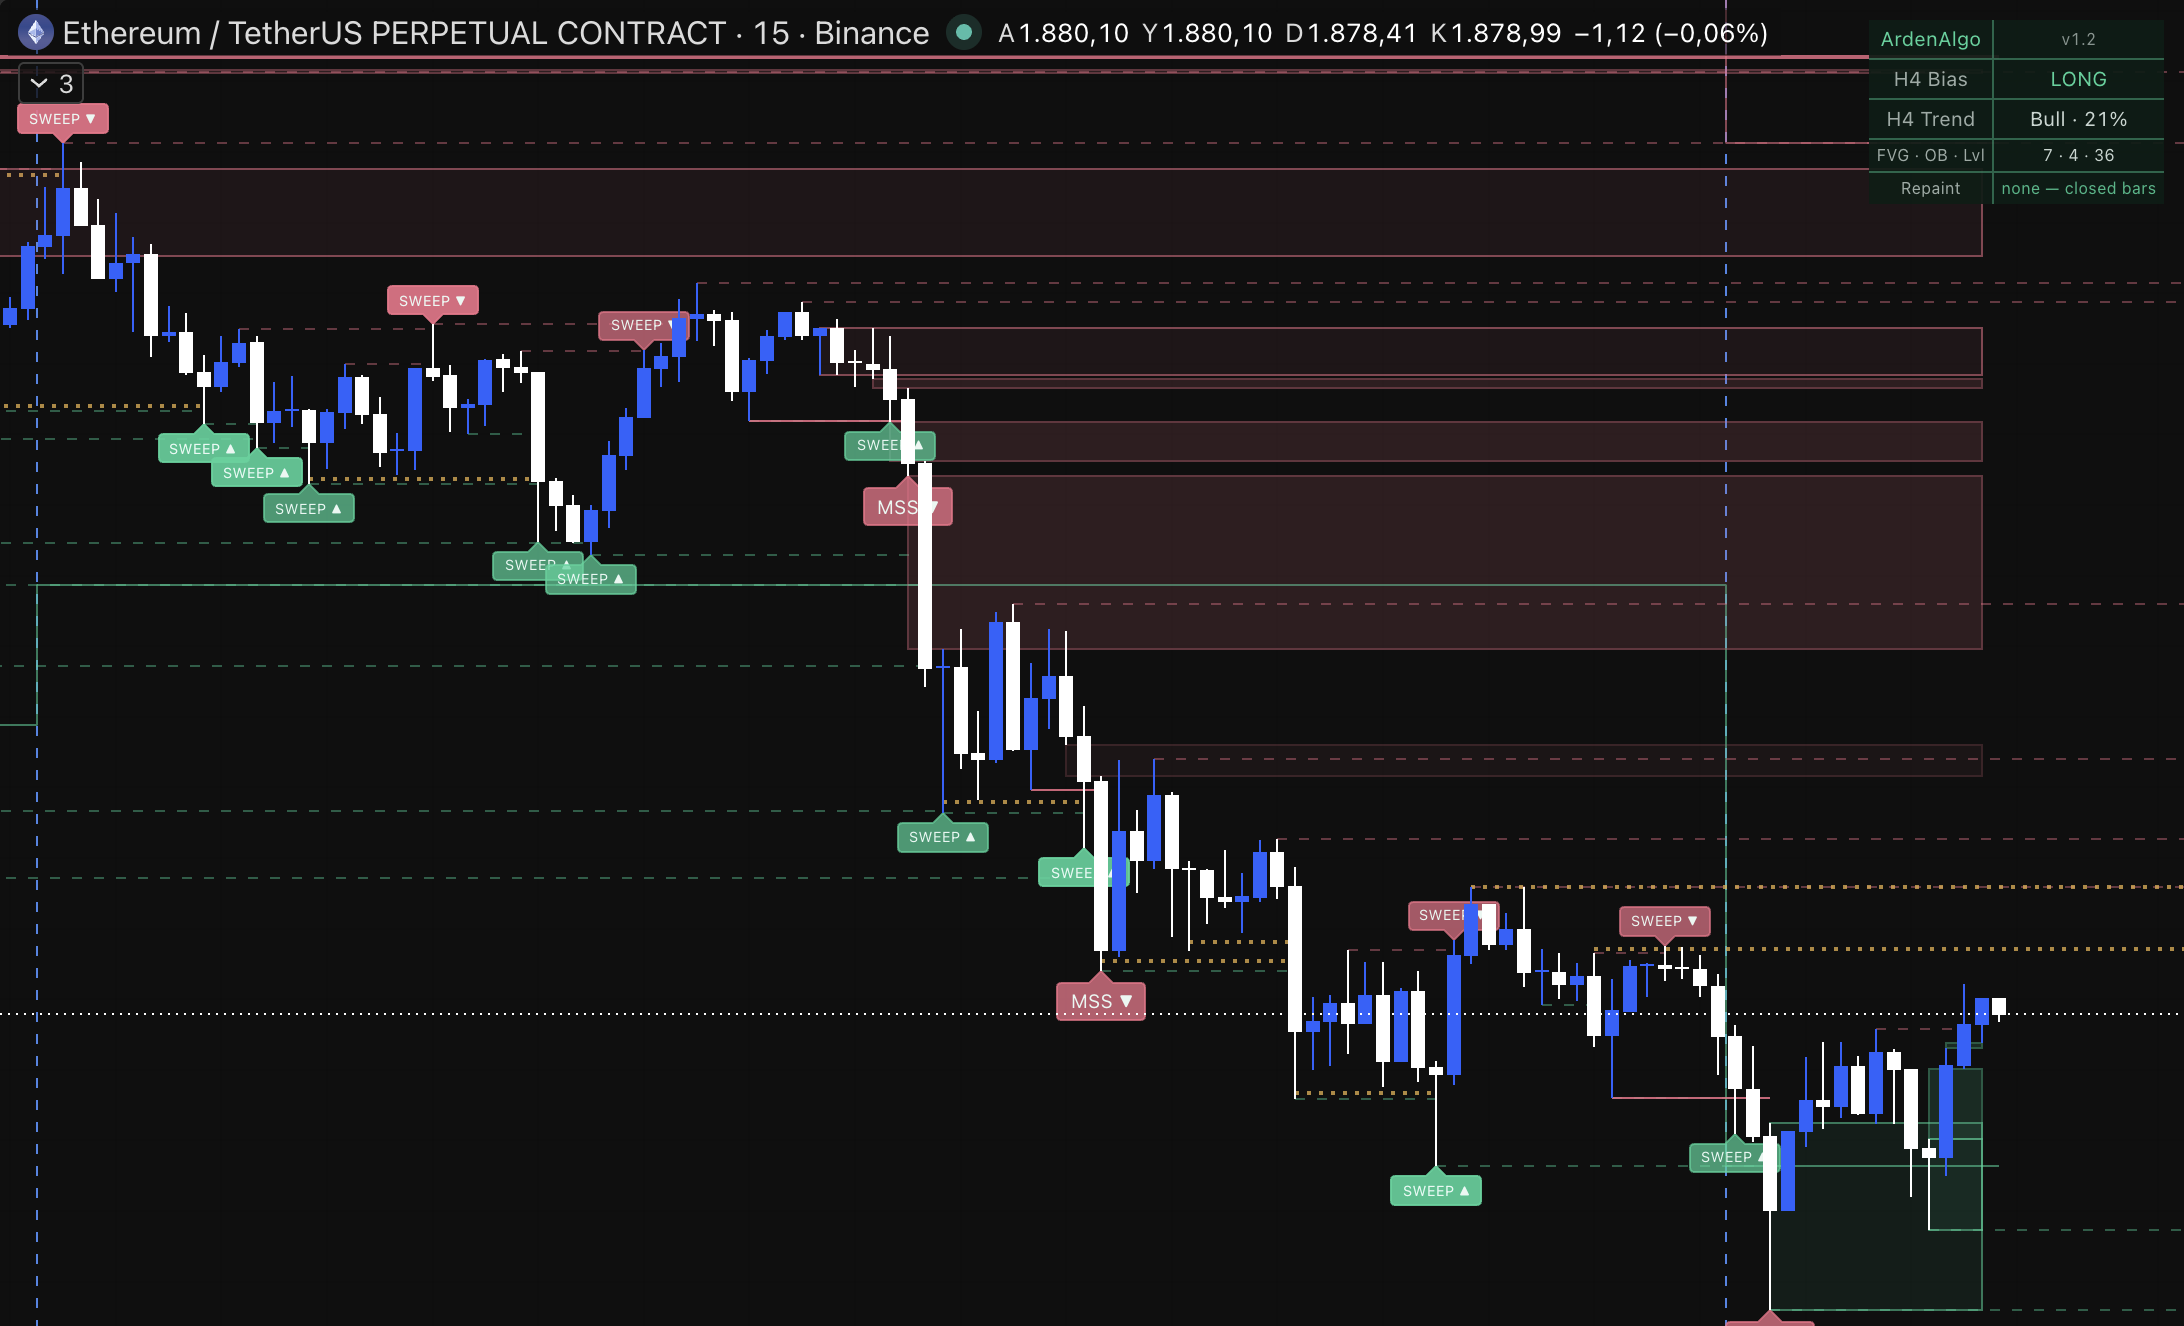
Wider view of the same indicator on a live chart.