ArdenAlgo
Equal highs & equal lows
- Equal highs and lows are clusters of swing extremes that sit within a tolerance band of each other.
- The engine groups swing pivots within 0.25 x ATR(14) and treats the cluster as one liquidity pool.
- A cluster stays on the map only while untapped; once price trades through it, it is gone for good.
What it is
When price turns at nearly the same level twice, chart-drawing tradition calls it a double top or double bottom and treats it as a wall. This engine reads the same picture differently: two rejections at one price means two batches of stop orders parked just beyond it. That is not a wall — it is fuel.
Why the tolerance matters
Set it too tight and equal highs almost never form; set it too loose and every wiggle joins a cluster until the chart is wallpaper. Tying it to ATR means the same rule behaves consistently on a quiet BTC afternoon and a violent SOL session, which is what lets one parameter serve eight markets.
Common misuse
Treating the level as a target in itself. In this engine a cluster is only interesting when it is swept and the structure answers — the pool is where the move begins, not where the trade ends.
Common questions
How equal is equal?
Within 0.25 x ATR(14) of each other. Absolute equality never happens on real charts, so the tolerance scales with volatility rather than being a fixed number of points.
Why do these levels attract price?
The premise is behavioural, not mystical: a visible double top is where stop orders accumulate, and resting orders are what large participants need in order to fill. Whether that premise pays after costs is what gate G2 tests.
Do equal highs guarantee a sweep?
No. Most mapped clusters are never swept at all, and plenty get broken outright. The map is an inventory of possibilities, not a forecast.
On a real chart
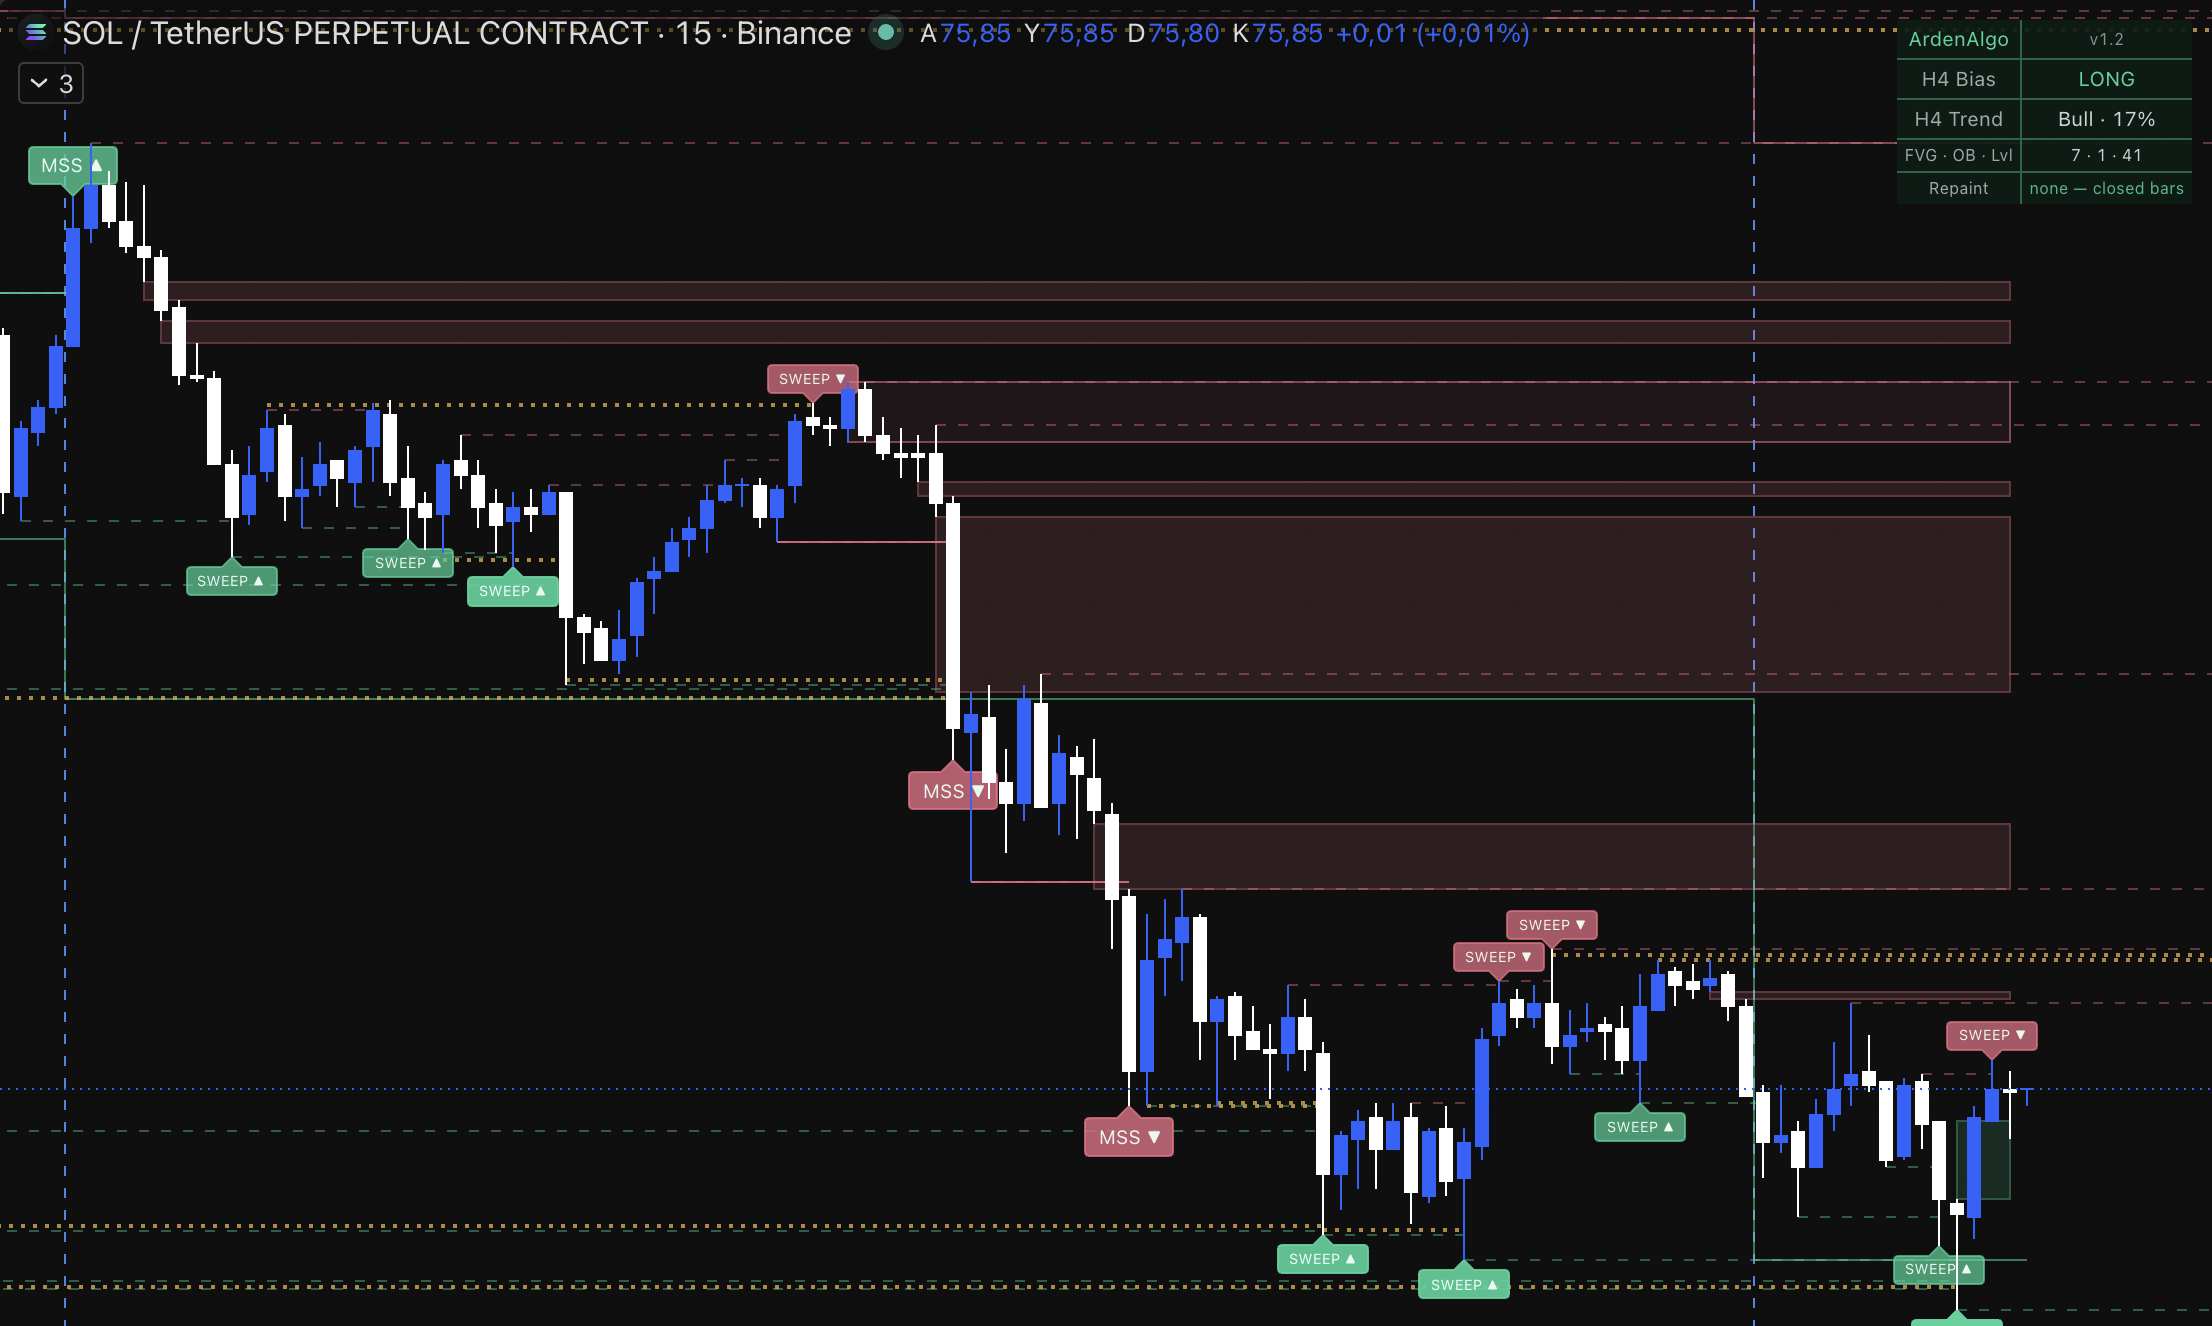
The engine's markings on a live chart — a screenshot from our TradingView showcase, not an illustration.